CHARACTERISTICS OF PRECIPITATION FOR PROPAGATION MODELLING: RECOMMENDATION ITU-R PN.837-1
This document contains information on the statistics of precipitation intensity is needed for the prediction of attenuation and scattering caused by precipitation;
This data with Rain Zones is used for planning of Microwave Links and Radio Links worldwide, especially for Rain Fade and Link Availability Calculations
When the rain climate zone is required in computer applications for any given set of geographic coordinates, the program RAINZONE be used. (The software for RAINZONE may be obtained from the ITU Radiocommunication Bureau.)
Rec. ITU-R PN.837-1 1
RECOMMENDATION ITU-R PN.837-1
CHARACTERISTICS OF PRECIPITATION FOR PROPAGATION MODELLING
Table 1 is used to obtain the expected median cumulative distribution of rain rate for the rain climate
region;
TABLE 1
Rain climatic zones
Rainfall intensity exceeded (mm/h) (Reference to Figs. 1 to 3)
ITU-837-1 Table 1
ITU-837-1-Fig1ITU-837-1-Fig2ITU-837-1-Fig3
The above charts show the rain zones around the world in for each country and region. This data is available in more up-to-date formats and used in many radio planning tools.
For Further Information
For More Information on Microwave Planning, Please Contact Us
Quadrature amplitude modulation (QAM) including 16QAM, 32QAM, 64QAM, 128QAM, 256QAM, 512QAM, 1024QAM, 2048QAM and 4096QAM is both an analog and a digital modulation scheme. It conveys two analog message signals, or two digital bit streams, by changing (modulating) the amplitudes of two carrier waves, using the amplitude-shift keying (ASK) digital modulation scheme or amplitude modulation (AM) analog modulation scheme.
Why are higher QAM levels used?
Modern wireless networks often demand and require higher capacities. For a fixed channel size, increasing QAM modulation level increases the link capacity. Note that incremental capacity gain at low-QAM levels is significant; but at high QAM, the capacity gain is much smaller. For example, increasing
From 1024QAM to 2048QAM gives a 10.83% capacity gain.
From 2048QAM to 4096QAM gives a 9.77% capacity gain.
QAM Increase Capacity Table
What are the penalties in higher QAM?
The receiver sensitivity is greatly reduced. For every QAM increment (e.g. 512 to 1024QAM) there is a -3dB degradation in receiver sensitivity. This reduces the range. Due to increased linearity requirements at the transmitter, there is a reduction in transmit power also when QAM level is increased. This may be around 1dB per QAM increment.
Comparing 512-QAM, 1024-QAM, 2048-QAM & 4096-QAM
This article compares 512-QAM vs 1024-QAM vs 2048-QAM vs 4096-QAM and mentions difference between 512-QAM, 1024-QAM, 2048-QAM and 4096-QAM modulation techniques. It mentions advantages and disadvantages of QAM over other modulation types. Links to 16-QAM, 64-QAM and 256-QAM is also mentioned.
Understanding QAM Modulation
Starting with the QAM modulation process at the transmitter to receiver in the wireless baseband (i.e. Physical Layer) chain. We will use the example of 64-QAM to illustrate the process. Each symbol in the QAM constellation represents a unique amplitude and phase. Hence they can be distinguished from the other points at the receiver.
64QAM Quadrature Amplitude Modulation
Fig:1, 64-QAM Mapping and Demapping
• As shown in the figure-1, 64-QAM or any other modulation is applied on the input binary bits.
• The QAM modulation converts input bits into complex symbols which represent bits by variation in amplitude/phase of the time domain waveform. Using 64QAM converts 6 bits into one symbol at transmitter.
• The bits to symbols conversion take place at the transmitter while reverse (i.e. symbols to bits) take place at the receiver. At receiver, one symbol gives 6 bits as output of demapper.
• Figure depicts position of QAM mapper and QAM demapper in the baseband transmitter and receiver respectively. The demapping is done after front end synchronization i.e. after channel and other impairments are corrected from the received impaired baseband symbols.
• Data Mapping or modulation process is done before the RF upconversion (U/C) in the transmitter and PA. Due to this, higher order modulation necessitates use of highly linear PA (Power Amplifier) at the transmit end.
QAM Mapping Process
64QAM Mapping Modulation
Fig:2, 64-QAM Mapping Process
In 64-QAM, the number 64 refers to 2^6.
Here 6 represents number of bits/symbol which is 6 in 64-QAM.
Similarly it can be applied to other modulation types such as 512-QAM, 1024-QAM, 2048-QAM and 4096-QAM as described below.
Following table mentions 64-QAM encoding rule. Check the encoding rule in the respective wireless standard. KMOD value for 64-QAM is 1/SQRT(42).
The 64-QAM mapper takes binary input and generates complex data symbols as output. It uses above mentioned encoding table to do the conversion process. Before the coversion process, data is grouped into 6 bits pair. Here, (b5, b4, b3) determines the I value and (b2, b1, b0) determines the Q value.
The above figure shows 512-QAM constellation diagram. Note that 16 points do not exist in each of the four quadrants to make total 512 points with 128 points in each quadrant in this modulation type. It is possible to have 9 bits per symbol in 512-QAM also. 512QAM increases capacity by 50% compare to 64-QAM modulation type.
1024-QAM modulation
1024QAM Modulation Constellation
The figure shows a 1024-QAM constellation diagram.
Number of bits per seymbol: 10
Symbol rate: 1/10 of bit rate
Increase in capacity compare to 64-QAM: About 66.66%
2048-QAM modulation
2048QAM Modulation Constellation
Following are the characteristics of 2048-QAM modulation.
Number of bits per seymbol: 11
Symbol rate: 1/11 of bit rate
Increase in capacity from 64-QAM to 1024QAM: 83.33% gain
Increase in capacity from 1024QAM to 2048QAM: 10.83% gain
Total constellation points in one quadrant: 512
4096-QAM modulation
4096QAM Modulation Constellation
Following are the characteristics of 4096-QAM modulation.
Number of bits per symbol: 12
Symbol rate: 1/12 of bit rate
Increase in capacity from 64-QAM to 409QAM: 100% gain
Increase in capacity from 2048QAM to 4096QAM 9.77% gain
Total constellation points in one quadrant: 1024
Advantages of QAM over other modulation types
Following are the advantages of QAM modulation:
• Helps achieve high data rate as more number of bits are carried by one carrier. Due to this it has become popular in modern wireless communication system such as LTE, LTE-Advanced etc. It is also used in latest WLAN technologies such as 802.11n 802.11 ac, 802.11 ad and others.
Following are the disadvantages of QAM modulation:
• Though data rate has been increased by mapping more than 1 bits on single carrier, it requires high SNR in order to decode the bits at the receiver.
• Needs high linearity PA (Power Amplifier) in the Transmitter.
• In addition to high SNR, higher modulation techniques need very robust front end algorithms (time, frequency and channel) to decode the symbols without errors.
For Further Information
For More Information on Microwave Links, Please Contact Us
The International Telecommunication Union (ITU), in its International Radio Regulations, divides the world into three ITU regions for the purposes of managing the global radio spectrum. Each region has its own set of frequency allocations, the main reason for defining the regions.
The International Telecommunication Union (ITU; French: Union Internationale des Télécommunications (UIT)), originally the International Telegraph Union (French: Union Télégraphique Internationale), is a specialized agency of the United Nations (UN) that is responsible for issues that concern information and communication technologies.
The ITU coordinates the shared global use of the radio spectrum, promotes international cooperation in assigning satellite orbits, works to improve telecommunication infrastructure in the developing world, and assists in the development and coordination of worldwide technical standards. The International Telecommunication Union is active in areas including broadband Internet, latest-generation wireless technologies, aeronautical and maritime navigation, radio astronomy, satellite-based meteorology, convergence in fixed-mobile phone, Internet access, data, voice, TV broadcasting, and next-generation networks. The agency also organizes worldwide and regional exhibitions and forums, such as ITU Telecom World, bringing together representatives of government and the telecommunications and ICT industry to exchange ideas, knowledge and technology.
For Further Information
For More Information on Microwave Links, Please Contact Us
What’s happening in MicrowaveBackhaul? According to the Ericsson Mobility Report Q4 2017, 3.3 billion mobile broadband subscribers will be added in the next five years, and a clear majority of these will come from LTE and 3G/HSPA in microwave-centric markets. The addition of an Indian greenfield LTE/4G operator and the densification needed to support proper MBB services will increase the number of sites, stabilizing microwave share on a global basis.
The large-scale 5G volume deployments are initially expected in areas with high fiber penetration, such as China, Korea, Japan and US.
There are also operators in Western Europe that have a combination of microwave and fiber, and are looking at introducing 5G. Larger volume rollouts of 5G networks are planned for a later point in the next few years.
Backhaul media distribution (excluding China, Japan, Korea and Taiwan)
In mature mobile broadband regions such as Western Europe, there are
examples of large operators using up to 80 percent microwave that now
plan for 5G introduction using existing microwave networks. Microwave
technology has evolved to manage the demand of mobile networks,
and can do so from any macro site. Core and inter-city aggregation
networks are typically deployed with fiber backhaul, while spurs are
implemented using microwave. It has also been observed that usage of
lower spectrum for longer-distance hops is decreasing in favor of
higher-frequency bands for short distance and high-capacity hops.
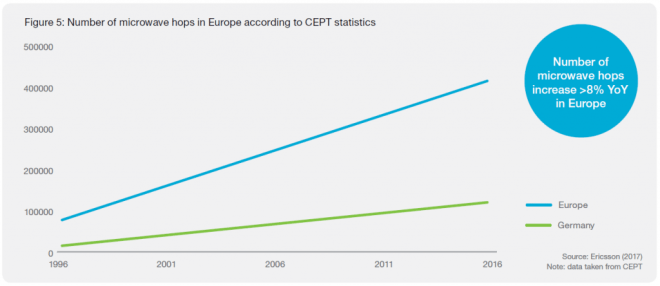
Number of Microwave Hops in Europe according to CEPT
Spectrum trends up to 2025
Spectrum below 3GHz will provide coverage in 5G. The 3–5GHz spectrum will enable high bandwidth balanced with good coverage. These bands are not used by microwave today to any major extent (apart from some 4 and 5GHz long-haul links). The extreme bandwidths in 5G will be enabled for hotspots and industry applications in spectrum above 20GHz.
It is clear that the main focus will be on bands 24–42GHz. In the US the FCC currently has a 24, 28 and 38GHz focus and in Europe there is a focus on 26GHz. 3GPP is specifying 5G bands in 24.25–29.5GHz and 37–43.5GHz in Release 15. It excludes 32GHz and E-band, which are both part of the ITU study and, in a recent report, the FCC stresses the importance of E-band for 5G backhaul. The decision on which bands to use and where, will be unique to each nation. But longterm parts of the 24–42GHz spectrum will be used more by 5G and less by microwave fixed services. In some of these bands, e.g. 26 and 38GHz
in Europe, there are many existing microwave links in several countries.
It will take time to move these links to other bands such as E-band. The 15–23GHz spectrum will remain as the global high-volume microwave bands. E-band will become a global high-volume band, both on its own and in a multi-band booster combination with 15–23GHz.
For long hops and as an economical replacement to fiber, 6–13GHz will also remain important. Due to their good propagation properties in geographical areas with high rain rates, these low frequencies are fundamental to building transport networks in certain regions.
With all of this taken into account, it is clear that the availability and usage of microwave spectrum will go through a major transformation in the next 5 to 10 years
New deployment share per frequency range
Higher Capacities: Radio Link Aggregation
When combining data over multiple carriers, radio link bonding is a key technology. An efficient bonding technique ensures that a single data stream is seamlessly transmitted across different radio channels, with negligible overhead. In the current Global market: About 80 percent of links are configured as single carriers (1+0), the remainder as multi-carrier links with backup links as protection. About 8 percent are set up with one active radio and the protection link in hot standby mode (1+1); 10 percent are configured with dual-carrier radio link bonding (2+0), where the capacity of the backup link is used to increase the link’s peak capacity. Only 2 percent are configured for three or more carriers (>2+0). Due to the need for increased transport capacity, the number of links aggregated over two or more carriers is rising globally.
Global distribution of radio link configurations. 80 percent are configured as single-carrier links (1+0), 20 percent are configured as multiple radio links
Total Cost of Ownership (TCO) and Return-on-Investment (ROI)
The total cost of ownership and time-to-market becomes critical to
secure the overall operator business case. As fiber investments typically
have a depreciation of around 25 years, and 5–8 years for microwave,
it becomes important to invest in fiber within the right areas, such
as core and aggregation networks, which historically have been
deployed with long-haul microwave.
Technology Evolution for Microwave
Over the past 20 years, microwave technology has been continuously
evolving to meet requirements. In 1996, microwave hops typically
supported 34Mbps, whereas today products have the ability to support
up to 1Gbps in traditional bands, and up to 10Gbps with E-Band.
Microwave Technology Roadmap and Evolution
Acknowledgement
Some content is (C) Ericsson reproduced with thanks, from Ericsson Mobility Report Q4 2017
For Further Information
For More Information on Microwave Links, Please Contact Us
Class 4 antennas provide the current best RF performance allowing mobile operators and Wireless Internet Service Providers (WISP) to increase the link capacity of a network by deploying new microwave links where high levels of interference are present. Class 4 antennas will allow customers to offer the highest performance in even the most congested environments. The higher side lobe suppression supports networks in ultra-dense areas and enables earlier reuse of frequencies. The lower interference increases the carrier-to-interference-ratio and allows smaller antennas with better link throughput, reducing tower leasing fees. The lower interference also enables higher modulation schemes, increasing the data capacity per antenna.
Benefits of a Class 4 Antenna
Increase the link capacity of the network
– Improved radiation patterns for ETSI Class 4 providing better performance
– Less interference and higher carrier-to-interference ratio
– Allows radios to operate at higher modulation levels
• Minimize the total cost of ownership
– Improved network efficiency
– Facilitates better re-use of a frequency channel
– Small antennas with better link throughput reduces tower leasing fees
Intended Use for Class 4 Antennas
Class 4 antennas are intended for “extremely high interference potential” situations, according to ETSI. For a more detailed treatment of antenna classifications and radiation patterns, see the ETSI document “Fixed Radio Systems; Point to Point Antennas.”
Wider channels, larger capacity
For situations where the operator needs to increase capacity from a wireless backhaul site, the easiest way remains widening the channel size. But at sites that experience extremely high interference, the operator may not be able to coordinate radio frequency pairs in wide channels with Class 3 antennas. However, moving up to Class 4 antennas would allow the operator to optimize the signal-to-noise ratio and let higher modulations come into play, so wide channels could be coordinated with correspondingly higher data rates
Smaller is Better
In cases of high interference, larger antennas can be used to reduce it. For a subset, smaller Class 4 antennas can be used instead of their oversize Class 3 counterparts. Thus, operators who deploy Class 4 antennas gain the added benefit of dropping down a parabolic dish antenna size as compared to a Class 3 antenna in the same application. In general, smaller dishes advantage the operator due to their lighter weight and lower opex tower charges, albeit with an initially bigger upfront capex. Because Class 4 antennas represent an elevated level of precision tooling and more detailed manufacturing versus lower class antennas, capex of these passive, higher-performance infrastructure pieces always weighs in the balance.
According to Andy Sutton, Principal Network Architect at EE:
Using Comsearch’s iQ.linkXG microwave planning software, CommScope analyzed the technical and commercial benefits of using Class 4 Sentinel antennas in the network. The results were most impressive. For the two frequency bands of the microwave backhaul network studied, which is comprised of over 6,200 links in total, the core findings were:
Potential savings of $5 million in total cost of ownership (TCO) over five years by enabling a greater link density and therefore reducing the need for third party Ethernet Leased Lines
Greater utilization of owned block allocated spectrum reduced the need for link by link licensing (from the national regulator) and therefore could save $44,000 in license fees over five years
$4.5 million could be saved per year based on optimizing capacity by freeing congested channels while still ensuring new links met the strict quality of service criteria
96 percent and 31 percent of links which couldn’t be planned due to frequency congestion in 40 and 10 GHz could be assigned a channel, respectively
A strong opportunity to trade some of the above by reducing antenna size and thus reducing TCO on tower lease costs
(content from EE above reproduced with acknowledgement from Commscope. Other content including photos from RFS).
For Further Information
For More Information on Microwave Links, Please Contact Us
Mean Square Error (MSE) is similar to Signal-to-Noise Ratio (SNR) except that it accounts for distortion and interference in addition to noise power.
CableFree Microwave ODU
Distortion may come from several sources such as bad Ethernet cables (poor shield, damaged, or low quality), path degradations such as multipath, or Fresnel zone encroachment.
Interference can come from other transmitters on the tower, as well as from sources inside an indoor shelter. High power transmitters inside a shelter can cause interference when near the PoE device or when located very close to the cabling.
There are maximum acceptable MSE values for each modulation which are useful in determining the quality of the link. The MSE value reported is only relevant to one tx-rx path, so the MSE of each tx-rx path must be evaluated to verify the link is operating as expected. The lower the number the better, so a -35dB is better than a -30dB.
Other possible causes for unacceptable MSE
These include
XPIC parameters are incorrect
Insufficient isolation between polarisations on an XPIC link
Insufficient performance to support high QAM modulation
Inbalance between paths on an XPIC dual polarity link
For Further Information
For More Information on Microwave Links, Please Contact Us
ITU-R P.837-6 P.0837-01 – Characteristics of precipitation for propagation modelling Radiowave propagation for Terrestrial Microwave Links and Radio Links for Point to Point (P2P, PTP) and Point to Multipoint (P2MP, PTMP) deployments.
Calculations can be made for Link Availability (%) for all frequency bands, to take into account link budgets, transmit power, receive sensitivity, antenna gain, target availability and other factors. Typical Link Availability Targets are 99.99%, 99.999% and higher.
ITU-R P.837-6 P.0837-01
ITU-R P.837-6 P.0837-01
Recommendation ITU-R P.837 contains maps of meteorological parameters that have been obtained using the European Centre for Medium-Range Weather Forecast (ECMWF) ERA-40 re-analysis database, which are recommended for the prediction of rainfall rate statistics with a 1-min integration time, when local measurements are missing.
Rainfall rate statistics with a 1-min integration time are required for the prediction of rain attenuation in terrestrial and satellite links. Data of long-term measurements of rainfall rate may be available from local sources, but only with higher integration times. This Recommendation provides a method for the conversion of rainfall rate statistics with a higher integration time to rainfall rate statistics with a 1-min integration time.
For Further Information
For More Information on Microwave Planning, Please Contact Us
70GHz to 80GHz bands (E-band) are used for Point to Point (P2P) Microwave (Millimeter Wave, MMW) Radio Links
Sources of Data and Graphics
All contents (C) OFCOM and taken from:
OfW48 UK Frequency Allocations for Fixed (Point-to-Point) Wireless Services and Scanning Telemetry This document shows the current bands managed by Ofcom that are available for fixed terrestrial (point to point) links and scanning telemetry in the UK.
Technical regulations
The Radio Equipment and Telecommunications Terminal Equipment Directive
99/5/EC (R&TTED) has been implemented in ‘The Radio Equipment and Telecommunications Terminal Equipment Regulations 2000, Statutory
Instrument (SI) 730. In accordance with Articles 4.1 and 7.2 of the R&TTED
the:
• IR2000: The UK Interface Requirement 2000 contains the requirements for the licensing and use of fixed (point-to-point) wireless services in the UK.
• IR2037: The UK Interface Requirement 2037 applies for scanning telemetry services.
• IR2078: The UK Interface Requirement 2078 applies for the 60 GHz band
Notes specific to the frequency charts
The first column describes each available frequency band, represented by a diagram (not to scale). The frequency band limits are listed below the diagram; frequencies below 10 GHz are represented in MHz, while those above 10 GHz are in GHz. The width of each guard band is shown above the diagram, and is always specified in MHz.
The channel arrangements in some bands are staggered, so that the width and position of the guard band vary for different channel spacings. In these cases, a table underneath gives details of the guard bands for different spacings (with all frequencies in MHz).
The first column also includes the title of the relevant international recommendations for each band, produced by the European Conference of Postal and Telecommunications (CEPT) or the International Telecommunication Union (ITU). CEPT recommendations are available at https://www.cept.org/ecc/ and ITU Recommendations at https://www.itu.int.
The final column contains the channel spacing for duplex operation in each frequency band except for bands above 60 GHz. Details of standard systems assigned in the UK are shown in the relevant technical frequency assignment criteria.
For Further Information
For More Information on Microwave Planning, Please Contact Us
58GHz, 60GHz and 65GHz bands are used for Point to Point (P2P) Microwave Radio Links. Also called V-band
Sources of Data and Graphics
All contents (C) OFCOM and taken from:
OfW48 UK Frequency Allocations for Fixed (Point-to-Point) Wireless Services and Scanning Telemetry This document shows the current bands managed by Ofcom that are available for fixed terrestrial (point to point) links and scanning telemetry in the UK.
Technical regulations
The Radio Equipment and Telecommunications Terminal Equipment Directive
99/5/EC (R&TTED) has been implemented in ‘The Radio Equipment and Telecommunications Terminal Equipment Regulations 2000, Statutory
Instrument (SI) 730. In accordance with Articles 4.1 and 7.2 of the R&TTED
the:
• IR2000: The UK Interface Requirement 2000 contains the requirements for the licensing and use of fixed (point-to-point) wireless services in the UK.
• IR2037: The UK Interface Requirement 2037 applies for scanning telemetry services.
• IR2078: The UK Interface Requirement 2078 applies for the 60 GHz band
Notes specific to the frequency charts
The first column describes each available frequency band, represented by a diagram (not to scale). The frequency band limits are listed below the diagram; frequencies below 10 GHz are represented in MHz, while those above 10 GHz are in GHz. The width of each guard band is shown above the diagram, and is always specified in MHz.
The channel arrangements in some bands are staggered, so that the width and position of the guard band vary for different channel spacings. In these cases, a table underneath gives details of the guard bands for different spacings (with all frequencies in MHz).
The first column also includes the title of the relevant international recommendations for each band, produced by the European Conference of Postal and Telecommunications (CEPT) or the International Telecommunication Union (ITU). CEPT recommendations are available at https://www.cept.org/ecc/ and ITU Recommendations at https://www.itu.int.
The final column contains the channel spacing for duplex operation in each frequency band except for bands above 60 GHz. Details of standard systems assigned in the UK are shown in the relevant technical frequency assignment criteria.
For Further Information
For More Information on Microwave Planning, Please Contact Us
52GHz and 55GHz bands are used for Point to Point (P2P) Microwave Radio Links
Sources of Data and Graphics
All contents (C) OFCOM and taken from:
OfW48 UK Frequency Allocations for Fixed (Point-to-Point) Wireless Services and Scanning Telemetry This document shows the current bands managed by Ofcom that are available for fixed terrestrial (point to point) links and scanning telemetry in the UK.
Technical regulations
The Radio Equipment and Telecommunications Terminal Equipment Directive
99/5/EC (R&TTED) has been implemented in ‘The Radio Equipment and Telecommunications Terminal Equipment Regulations 2000, Statutory
Instrument (SI) 730. In accordance with Articles 4.1 and 7.2 of the R&TTED
the:
• IR2000: The UK Interface Requirement 2000 contains the requirements for the licensing and use of fixed (point-to-point) wireless services in the UK.
• IR2037: The UK Interface Requirement 2037 applies for scanning telemetry services.
• IR2078: The UK Interface Requirement 2078 applies for the 60 GHz band
Notes specific to the frequency charts
The first column describes each available frequency band, represented by a diagram (not to scale). The frequency band limits are listed below the diagram; frequencies below 10 GHz are represented in MHz, while those above 10 GHz are in GHz. The width of each guard band is shown above the diagram, and is always specified in MHz.
The channel arrangements in some bands are staggered, so that the width and position of the guard band vary for different channel spacings. In these cases, a table underneath gives details of the guard bands for different spacings (with all frequencies in MHz).
The first column also includes the title of the relevant international recommendations for each band, produced by the European Conference of Postal and Telecommunications (CEPT) or the International Telecommunication Union (ITU). CEPT recommendations are available at https://www.cept.org/ecc/ and ITU Recommendations at https://www.itu.int.
The final column contains the channel spacing for duplex operation in each frequency band except for bands above 60 GHz. Details of standard systems assigned in the UK are shown in the relevant technical frequency assignment criteria.
For Further Information
For More Information on Microwave Planning, Please Contact Us


 Class 4 antennas provide the current best RF performance allowing mobile operators and Wireless Internet Service Providers (WISP) to increase the link capacity of a network by deploying new microwave links where high levels of interference are present. Class 4 antennas will allow customers to offer the highest performance in even the most congested environments. The higher side lobe suppression supports networks in ultra-dense areas and enables earlier reuse of frequencies. The lower interference increases the carrier-to-interference-ratio and allows smaller antennas with better link throughput, reducing tower leasing fees. The lower interference also enables higher modulation schemes, increasing the data capacity per antenna.
 Class 4 antennas are intended for “extremely high interference potential” situations, according to ETSI. For a more detailed treatment of antenna classifications and radiation patterns, see the ETSI document “


You must be logged in to post a comment.